
Optimizing the Loading Process for the 311 Data Analysis Tool
Overview
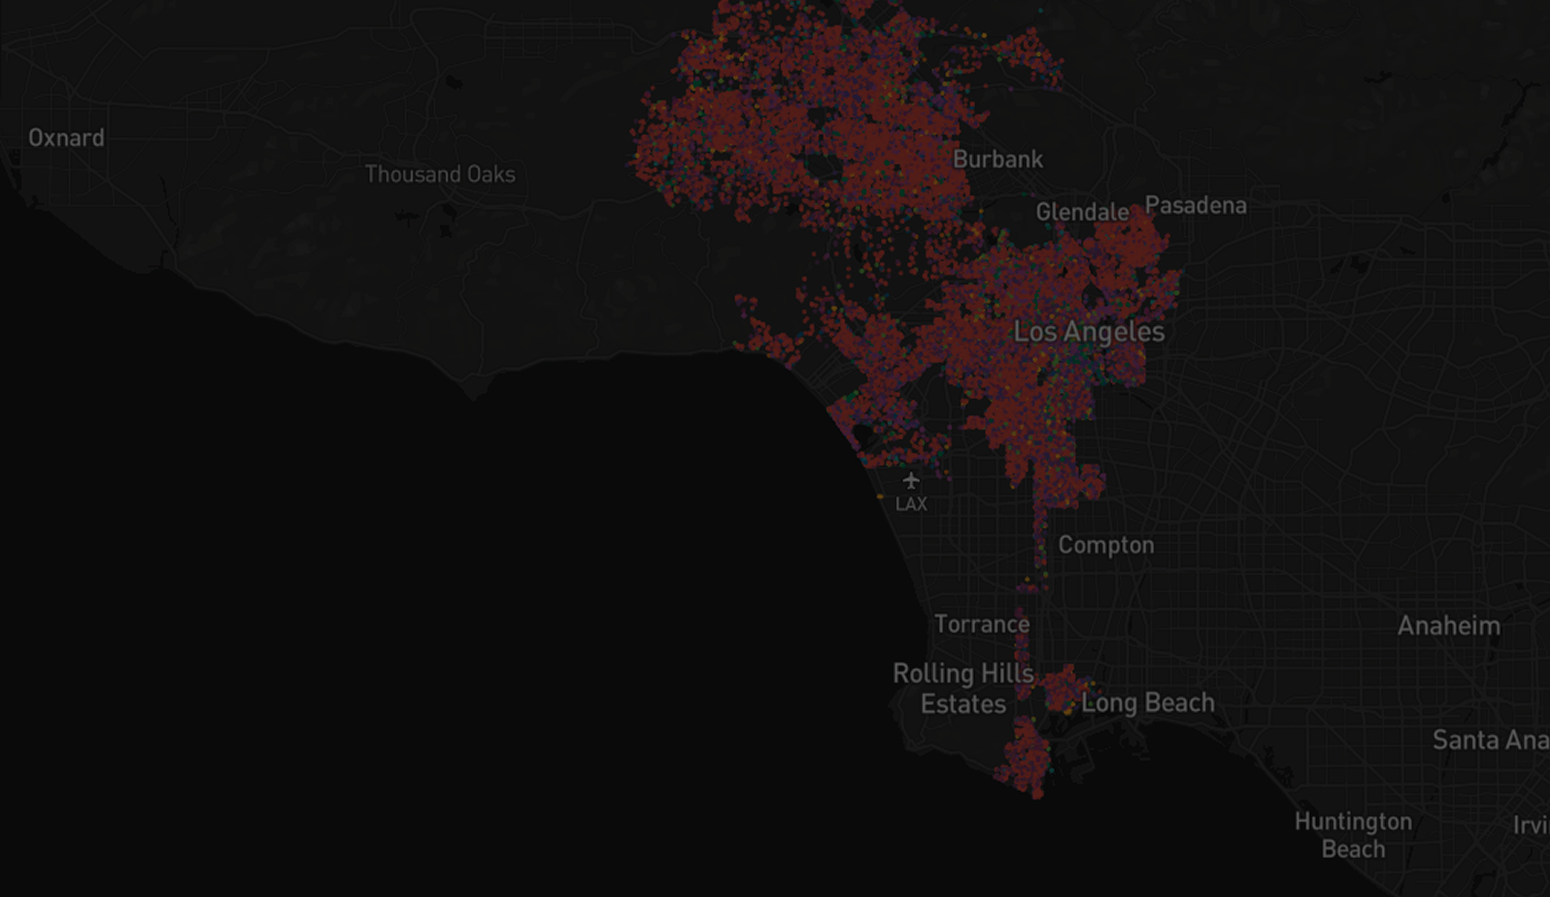
311 Data is a data analysis tool that aggregates publicly available data for 311 service requests across the city of Los Angeles, which can then be used by LA Neighborhood Councils to better determine and address their communities’ needs. Over the course of three months, I was part of a pre-launch project to rehaul and optimize the loading process.
The Challenge
Our primary goals for this process were to:
Make it clear that our website was separate from and not affiliated with the City of Los Angeles
Buy time and keep users engaged while waiting for long loading times
Role
UX Designer

Collaborator
Luan Nguyen
The Process
Rethinking the Loading Process
At the beginning of this project, we had an initial loading screen design to work with, but it needed many updates to address the two main aforementioned issues. The initial loading screen had rotating modals with various fun facts about the city of Los Angeles. Before choosing a specific design, everyone on the design team individually brainstormed some potential solutions.
For my proposal, I removed this feature altogether to reduce the likelihood of being associated with the city of Los Angeles. Instead, I created two potential loading screens, both reinforcing our organizations’ branding (311 Data and our parent organization, Hack for LA). Once the data finished loading, they a modal would appear with an explicit non-affiliation message that included a link to the official 311 service website for users who were looking for assistance from the city.
Designing for Longer Loading Times
Because there was so much data to load, we found that users would be stuck on the loading screen for anywhere between 10-20 seconds before being able to interact with the website. To buy time and reassure users that nothing was frozen, I created a loading screen with a progress bar.

Agreeing on a Solution
After presenting each of our proposed solutions, the design team agreed to go forward with my designs along with another collaborating designer’s, Luan Nguyen.
Luan’s Designs

Creating a Unified Design
We collaborated to create our first iteration, applying the color palette from our design system and creating another loading modal with our branding and progress bar. After some internal feedback, we tweaked some UI elements for better visual balance. Because the data could take up to 20 seconds to load, we added a percentage indicator and changed the colors for more accessible visual contrast.

Pivoting because of Limitations
We were faced with some setbacks after handing off our designs to the development team. Our data system wasn’t able to determine when all data points were completely loaded, so including a percentage-based progress bar wasn’t feasible at this point. I explored other potential loading animations that could indicate to users that nothing has frozen and data is still loading. In addition to new animations, because of the long loading times, we also revisited the initial modals with fun facts to increase user retention. Instead of including facts about Los Angeles, I decided that making them about our organizations (311 Data and Hack for LA), would decrease the likelihood of users associating us with the city of Los Angeles.
Exploring Alternative Loading Animations
Our Re-Envisioned Loading Process


Future Plans
There were certainly unexpected changes that required deviations, particularly with how to buy time for a longer loading process and convey loading progress. Though this resulted in a less than ideal shipped product, we were able to plan for post-launch features.
After officially launching our website, we hope to revisit our original plans as well as some new ones that may increase user retention during long loading times.